Current Conditions
North Carolina
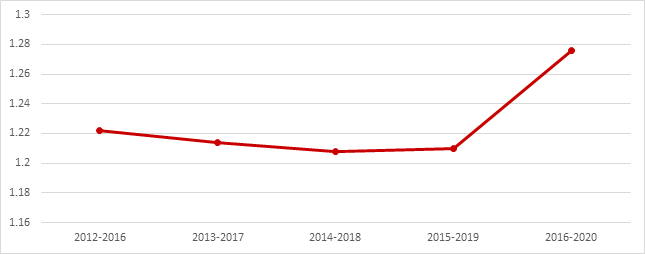
North Carolina fatal crash rates had been slowly decreasing or plateauing over the last several years. The fatal 5-year average in 2016 was 1.222 and dropped to 1.208 before slightly increasing to 1.210 in 2019. Data for the 2020 5-year average period is preliminary and subject to finalization and adoption by NCDOT. At this time, the 2020 5-year average shows a significant increase in the rate of fatalities across North Carolina.
NC Fatality Rate Trends
(Crashes per 100 million Vehicle Miles Traveled)
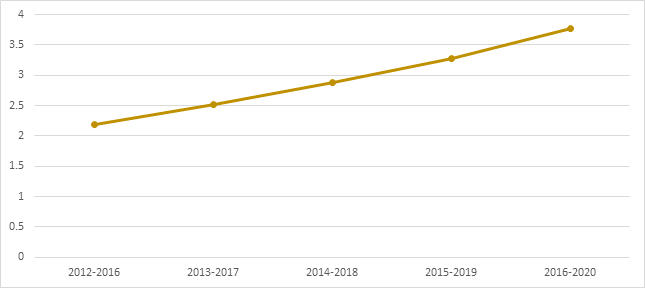
North Carolina serious injury crash rates had been slowly increasing over the last several years. The serious injury 5-year crash average rose from 2.19 in 2016 to 3.28 in 2019. Data for the 2020 5-year average period is preliminary and subject to finalization and adoption by NCDOT. At this time, the 2020 5-year average shows a steady increase in the rate of serious injury crashes across North Carolina.
NC Serious Injury Rate Trends
(Crashes per 100 million Vehicle Miles Travel)
Statewide Safety Targets (CY 2021 by December 31, 2021)
BGMPO is responsible for setting five annual safety performance metrics as shown below. The development of the BGMPO transportation safety plan helps to inform the region on how it sets future performance targets and identify strategies to help the region meet its safety goals. For 2021, BGMPO adopted the Statewide safety performance targets as shown in the adjacent chart.
Category |
Annual Percent Reduction |
|---|---|
Fatalities |
-4.20% |
Fatality Rate |
-4.35% |
Serious Injuries |
-3.24% |
Serious Injury Rate |
-3.35% |
Non-Motorized Fatalities & Serious Injuries |
-3.65% |
BGMPO
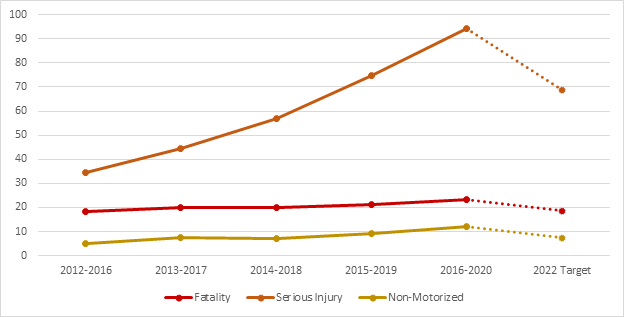
Within the BGMPO area, serious injury crashes have been increasing dramatically over the last five years from a 5-year average of 34.6 in 2016 to 94.2 in 2020. Fatal crashes have slowly been increasing in the BGMPO area from a 5-year average of 18.2 in 2016 to 23.4 in 2020. Similarly, non-motorized crashes have seen a steady uptick in crashes from a 5-year average of 5.2 in 2016 to 12.2 in 2020. Please note that data for the 2020 5-year average period is preliminary and subject to finalization and adoption by NCDOT.
BGMPO Fatal & Serious Injury Trends
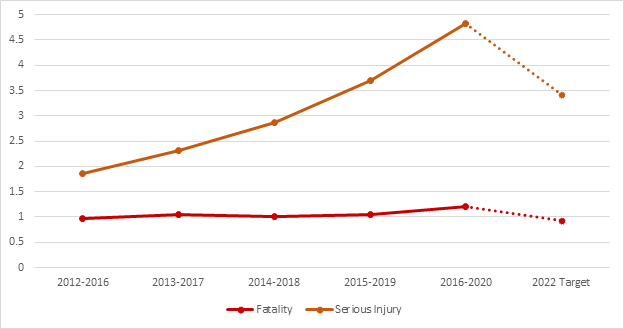
Similar to the number of crashes, the rate of fatal and serious injury crashes per 100 million vehicle miles traveled (VMT) has increased over the study time period. Serious injury crashes have risen dramatically from a 5-year average of 1.86 serious injury crashes per 100 million VMT in 2016 to 4.83 in 2020. In comparison to the statewide average, serious injuries crashes in the BGMPO region are rising significantly compared the slight rise that North Carolina has seen. Fatal crashes have been slightly increasing from a 5-year average of 0.98 fatal crashes per 100 million VMT in 2016 to 1.21 in 2020. In comparison to the statewide average, fatal crashes in the BGMPO region are trending slightly upward whereas across the state the trend has been trending downward. Please note that data for the 2020 5-year average period is preliminary and subject to finalization and adoption by NCDOT.
BGMPO Fatal & Serious Injury Rate Trends
(Crashes per 100 million Vehicle Miles Traveled)
Contact Us
Wannetta Mallette
Burlington-Graham Metropolitan Planning Organization
Phone: (336) 513-5418